Average Daily Time on Social Media: Statistics, Trends & Insights

Social media is a place where the world connects, shares all the latest information, gets a free space for self-expression, and fetches nonstop entertainment.
The excessive amount of time spent on social media isn’t shocking, considering how our offline social lives are rapidly fading. However, the rising screen time does pose serious mental and physical health concerns.
Let’s find out what our day-to-day social media usage looks like and how it impacts the world around us.
What Is the Average Daily Time Spent on Social Media?
The global average for daily time spent on social media is 2.35 hours (2 hours and 21 minutes). In comparison, social media users in the U.S. score an average of 2 hours and 9 minutes.
The world population has exceeded 8 billion, and over 5 billion people use social media. It’s safe to say that nearly everyone who has access to a reliable internet connection and a personal computing/mobile device has had a taste of the virtual socializing platforms.
Global Average Daily Social Media Time (2015 – 2025)
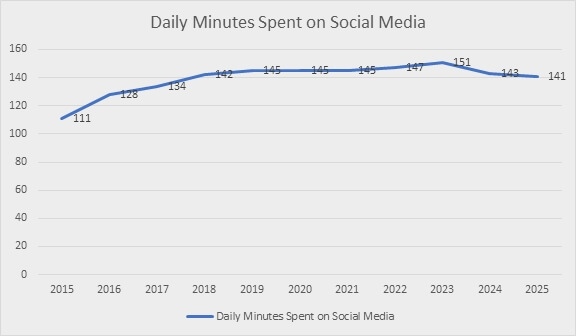
Data suggests that daily minutes spent on social media increased steadily from 2015 to 2019. The average time plateaued from 2019 to 2021 (during the COVID-19 pandemic) and then shot up in 2022 and 2023.
Following 2023, we see a sharp decline in social media minutes, which can be acknowledged as a positive sign. To conclude, at present, we spend about half an hour more on social media than we did a decade ago.
Food for Thought:
How much time we spend on social media matters to the people around us, consumer brands, and policymakers.
On a personal level, it affects our productivity and relationships; at a larger scale, it dictates digital marketing trends and might contribute to a global public health or data privacy catastrophe.

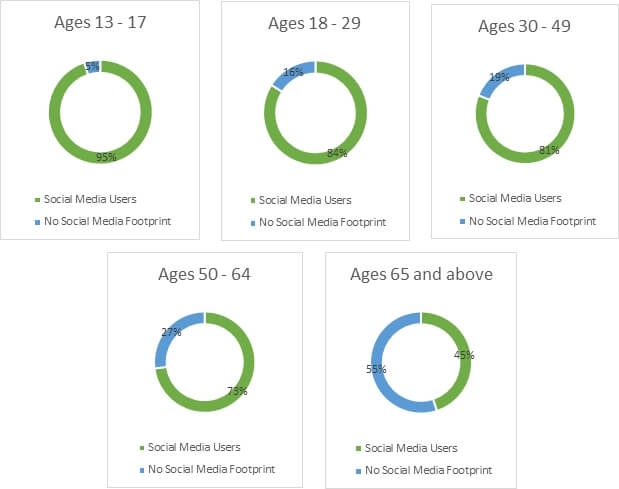
Average Time Spent on Social Media by Age Group
As one would expect, the younger generations are more inclined towards social media platforms. Teens are particularly addicted to social media trends, and young adults (Gen Z and Millennials) often use social media for work rather than just time-pass and entertainment.
Looking at the portion of the population that doesn’t have a social media footprint, it’s crystal-clear that older individuals take the lead. Below is a breakdown of social media users and those who lack a social media footprint within different age groups:
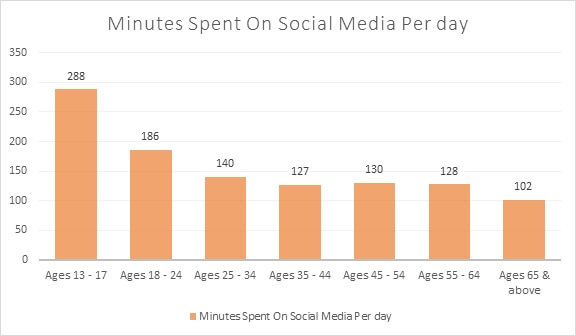
Since the majority of younger adults in the U.S. are active social media users, it’s easy to assume that they’re also the ones who spend more time on these platforms. Here’s a comparison of average time spent on social media by age group:
Don’t let slow internet prolong your screen time with lag and buffering. Upgrade to fiber-optic internet for smoother scrolling.
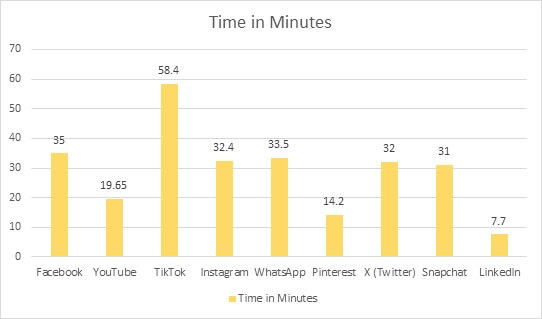
Average Daily Time on Social Media by Platform
The average internet user engages with 6-7 social media apps a month, whereas daily engagement is usually limited to 2-3. This pattern is understandable as most of us have accounts on several platforms, but we don’t like to visit some of them too frequently.

The global popularity and user engagement trends for different social media platforms have changed over time – the platforms with the highest number of visitors right now include:
Facebook has the largest user base with over 3 billion monthly active users, at least half of them are Millennials (ages 30 – 45). This network is primarily used to keep in touch with friends & family, and the average user (including those in the U.S.) spends about 30 – 35 minutes on the platform per day.
TikTok
TikTok was one of the top three fastest-growing social media networks in 2025 and has over 1.5 billion monthly active users. It is mainly preferred by the younger generations (Gen Z and teenagers) for short-form entertaining content, and the average user spends almost an hour on the platform daily.
Instagram has about 2 billion active monthly users and is the #1 platform for sharing photos and videos; moreover, it is widely used to discover local businesses and engage with brands. The audience on Instagram primarily consists of Gen Z and Millennials, while the average daily time spent on here is nearly 33 minutes.
Snapchat
Snapchat has approximately 850 million active monthly users across the globe, and is popular for sharing creative visual content. This platform is adored by the younger audience (teens and Gen Z), and more than 5 billion snaps are created every day. The time spent on this platform per day is 31 minutes on average.
X (Twitter)
User base of X (Twitter) has declined in recent years, yet it remains on the list of top 20 social media platforms worldwide. At present, X has over 550 million active users, who, for the most part, use it to keep up with the latest news and current affairs. The average daily time spent on the social media app is 32 minutes.
Stream, scroll, and share faster with high-speed internet.
Discover and Compare the Best Internet Providers in Your Area
Comparison of Average Daily Time Spent on Leading Social Media Platforms 2025
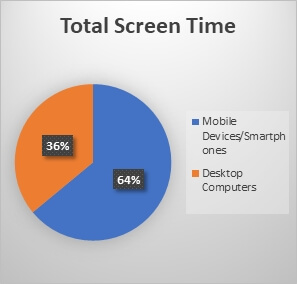
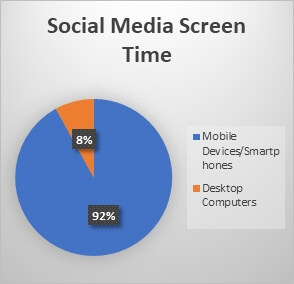
Social Media Screen Time: Mobile vs Desktop
Nearly 98% of the world’s population with broadband access has used the internet on their smartphones. The screen time for smartphones and other mobile devices has readily increased over the years because of their mobility and convenience.
While the overall screen time for desktop computers has decreased, it’s important to note that the average duration of online sessions is longer.
Apps for social media platforms are easy to access and use on our smartphones as opposed to from a browser on a desktop computer. On the contrary, desktop computers are preferred for time-consuming and high-bandwidth activities, such as gaming, working, and deep research, etc.
How Social Media Usage Has Changed Over Time
Social media was born in the late 90s with a short-lived platform called Six Degrees. Later came sites like Friendster, MySpace, and Orkut, but it was between 2007 and 2008 when Facebook became viral and created a social media boom.
Social media usage grew as access to the internet and smartphones/mobile devices increased. Many more social apps were introduced over the years; some replaced older ones, and a few, like Facebook, evolved to stay in the race.
2019–2021 (Pandemic Effect)
A surge in social media usage was witnessed during the COVID-19 pandemic lockdown. Since people were isolated in their homes, they turned to social media to maintain human connections. Being able to communicate with the world during these tough times helped them escape boredom and depression.

It was between 2019-2021 that short-form video content started trending, and platforms like TikTok grew tremendously.
People craved authentic experiences, and content they could relate to – and thus, the era of Vloggers and influencers began.
2022–2025 Trends
The time spent on social media plateaued during the pandemic, and surprisingly, it did not decline afterwards. Social media usage further increased in 2022, as the habits formed earlier solidified and the scope of social platforms magnified.
Short-form content clung to dominate the industry, and people started using social media for more than just connecting with family/friends and casual entertainment.
Social media apps transformed into money-making machines once people started using them for brand-building, online marketing, e-commerce, and the creation of valuable content.

Make the most of your time spent on social media with smarter internet. Let the power of 5G make every minute count!
Average Daily Time on Social Media by Country
Believe it or not, the U.S. does not make the list of countries that spend the most time on social media. According to 2025’s statistics, Kenya takes the lead with an average of 4.2 hours.
Below are the top 10 countries with the highest average daily time spent on social media platforms:
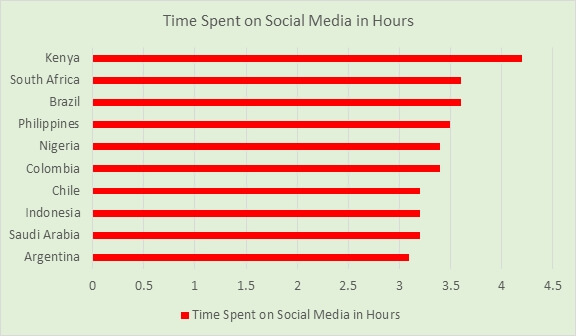
Social media usage by a country is influenced by culture, internet infrastructure, and geography. Most of the countries that exceed the global average daily time spent on social media are:
- Highly dependent on social apps for communication, work, and business
- Home to a larger proportion of a younger population that is well-connected
- Accustomed to a mobile-first approach and video-driven content
The countries that spend the least amount of time on social media include Japan, South Korea, and the U.K. While these countries are not behind in technological advancement, the low consumption of social media content mainly has to do with culture.
Why People Spend So Much Time on Social Media
Social media is designed to appeal to our psychological needs. It operates on a dopamine reward system, which is why it is highly addictive. It can offer emotional connection, validation, and escapism, as well as trigger fear of missing out (FOMO).
These four pillars of social media are what keep consumers coming back for more:
24/7 Entertainment
Our attention span is dwindling and we’re constantly craving quick entertainment. Infinite scrolls and unlimited short-form content on social media provide the dopamine release or distraction we need.
Latest News & Trends
Watching the news on TV is too old-fashioned for the younger generations. Social media is where everything is broadcast from all over the world nowadays – from current affairs and politics to all the viral dance challenges.
Social Connection
Modern lifestyles influenced by remote work and study trends have significantly reduced in-person social interactions. Social media apps are the alternative for building relationships and maintaining a connection with loved ones.
Consumerism
Social media is where we discover local brands and businesses. Whether we’re seeking a specific cuisine or looking for a new outfit, social media is where we find inspiration and reliable recommendations.
Is Average Social Media Time Increasing or Decreasing?
Despite the growing popularity and reliance on social media platforms, the global average daily time spent on them is decreasing.
The numbers have been falling from 2023 to date, and key reasons for this change include:
- The primary users (young adults) are becoming more conscious of the negative health impacts associated with prolonged screen time; hence, they are shifting towards healthier offline activities.
- Lately, the abundance of short-form AI-generated content has reached saturation and deprived the audience of authentic experiences; repetitive and unoriginal content has reduced engagement.
- Many users have adopted the “Posting Zero” policy, which entails keeping their personal lives off social media to put a stop to harmful exposure, targeted ads/algorithmic pressure, and burnout.
In summary, people are choosing quality over quantity for their digital well-being.
Impact of Social Media Screen Time
How much time we spend on social media affects various aspects of our lives, as well as digital marketing trends.
Productivity & Focus
Constant notifications and endless scrolling through short-form content on social media lead to mental exhaustion and reduced attention span. As a result, we experience headaches, eye-strain, and fatigue, which leads to procrastination and low efficiency at work/school.
Mental Health & Sleep
The FOMO and dopamine carvings triggered by social media may cause anxiety, depression, and insomnia. Certain influencers or content may provoke self-esteem and body-image issues that activate destructive habits and behaviors.
Marketing & Advertising ROI
The longer your stay on social media sites, the greater your exposure to targeted advertisements. Social media’s advanced algorithm collects your data and interprets your interests to deliver content accordingly. More engagement and purchases for your side result in a higher return on investment (ROI) for them.
Average Daily Time on Social Media: Key Statistics Summary
- The global average for daily time spent on social media is 2.35 hours or 2 hours and 21 minutes.
- Average daily time on social media for the U.S. is 2 hours and 9 minutes
- Out of a world population of over 8 billion, 5 billion+ people use social media, which amounts to around 70%.
- Time spent on social media was on the rise until 2023, and has been gradually declining since then.
- Teens and Gen Z spend the most time on social media apps.
- The average internet user engages with 6-7 social media apps a month, and up to 2 or 3 a day.
- YouTube, Facebook, TikTok, and Instagram have the highest engagement/number of monthly active users.
- More than 90% of social media screen time comes from mobile devices.
- Kenya has the highest average daily time on social media at 2 hours (as of 2025)
- People in Japan, South Korea, and the K. spend the least amount of time on social media platforms.
Frequently Asked Questions
How many hours do people spend on social media daily?
With reference to the global average, most people spend around 2 – 2.5 hours on social media daily.
What age group uses social media the most?
Teens and young adults (ages 13 – 24) are the primary users of social media apps.
Which social media app has the highest daily usage?
Facebook and YouTube have the highest daily usage, as these platforms engage users from all age groups.
Is social media screen time increasing?
Time spent on social media has been on the decline since 2023, owing to growing awareness of health impacts due to extended screen time, AI-content saturation, growing privacy concerns, etc.
How much social media time is considered unhealthy?
Daily social media exposure that exceeds 2-3 hours is deemed significantly unhealthy.
Table of content
- What Is the Average Daily Time Spent on Social Media?
- Global Average Daily Social Media Time (2015 – 2025)
- Average Time Spent on Social Media by Age Group
- Average Daily Time on Social Media by Platform
- Social Media Screen Time: Mobile vs Desktop
- How Social Media Usage Has Changed Over Time
- Average Daily Time on Social Media by Country
- Why People Spend So Much Time on Social Media
- Is Average Social Media Time Increasing or Decreasing?
- Impact of Social Media Screen Time
- Average Daily Time on Social Media: Key Statistics Summary
- Frequently Asked Questions